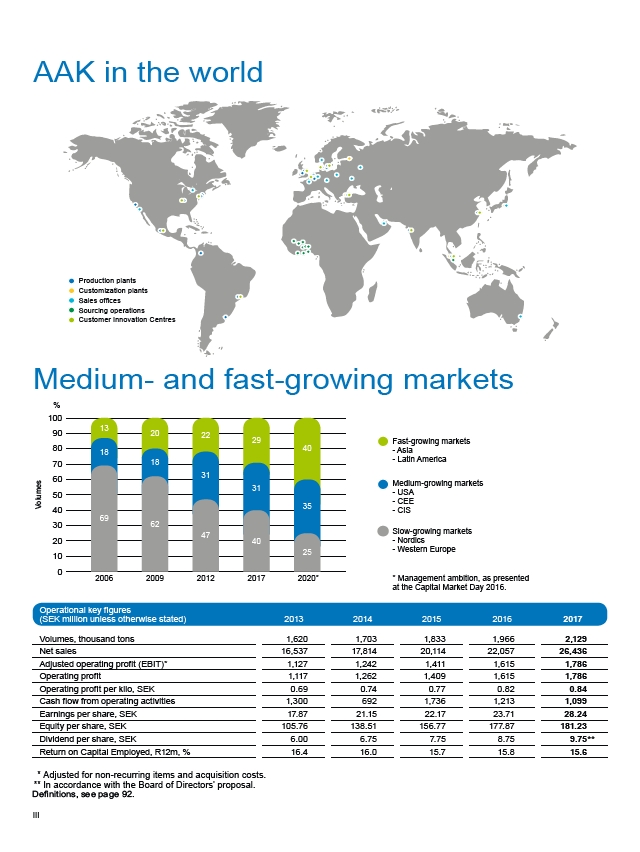
AAK in the world
Medium- and fast-growing markets
Fast-growing markets
- Asia
- Latin America
Medium-growing markets
- USA
- CEE
- CIS
Slow-growing markets
- Nordics
- Western Europe
* Management ambition, as presented
at the Capital Market Day 2016.
%
100
90
80
70
60
50
40
30
20
10
0
20
18
62
2009
13
18
69
2006
22
31
47
2012
29
31
40
2017
40
35
25
2020*
Production plants
Customization plants
Sales offices
Sourcing operations
Customer Innovation Centres
III Volumes
Operational key figures
(SEK million unless otherwise stated) 2013 2014 2015 2016 2017
Volumes, thousand tons 1,620 1,703 1,833 1,966 2,129
Net sales 16,537 17,814 20,114 22,057 26,436
Adjusted operating profit (EBIT)* 1,127 1,242 1,411 1,615 1,786
Operating profit 1,117 1,262 1,409 1,615 1,786
Operating profit per kilo, SEK 0.69 0.74 0.77 0.82 0.84
Cash flow from operating activities 1,300 692 1,736 1,213 1,099
Earnings per share, SEK 17.87 21.15 22.17 23.71 28.24
Equity per share, SEK 105.76 138.51 156.77 177.87 181.23
Dividend per share, SEK 6.00 6.75 7.75 8.75 9.75**
Return on Capital Employed, R12m, % 16.4 16.0 15.7 15.8 15.6
* Adjusted for non-recurring items and acquisition costs.
** In accordance with the Board of Directors’ proposal.
'H¿QLWLRQVVHHSDJH