Reasons to invest in AAK
1 3
The underlying global growth in the segments in which AAK
is present is normally in line with global GDP growth. AAK
has in the past been able to grow faster than the underlying
markets in our focus areas – speciality and semi-speciality
solutions in Food Ingredients and Chocolate & Confectionery
Fats – despite not having a fully global footprint. With our
JUHHQ¿HOGLQYHVWPHQWVDQGRXUODWHVWDFTXLVLWLRQVLQJURZWK
markets, we have strengthened our footprint and become
a truly global company. Our ambition is to continue to grow
faster than the underlying markets.
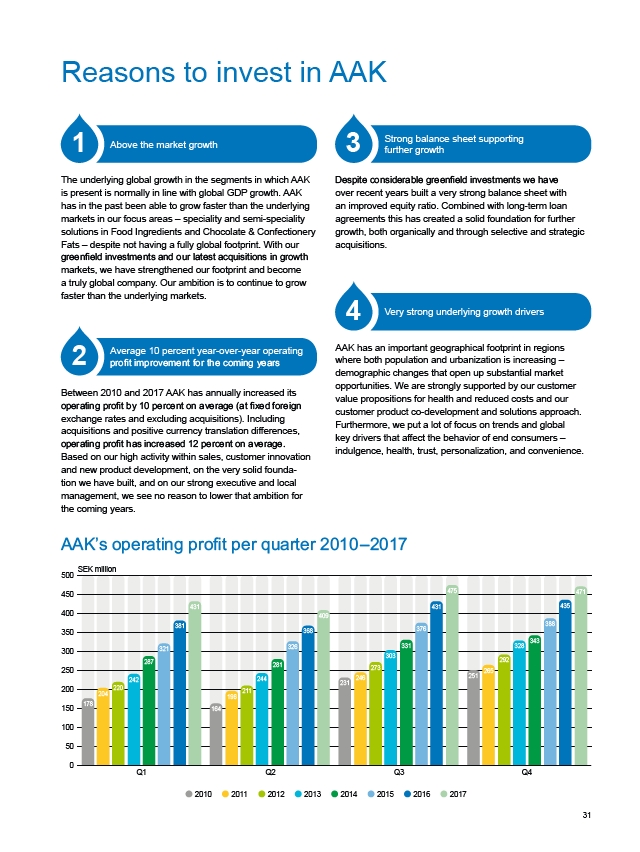
Between 2010 and 2017 AAK has annually increased its
RSHUDWLQJSUR¿WE\SHUFHQWRQDYHUDJHDW¿HGIRUHLJQ
exchange rates and excluding acquisitions). Including
acquisitions and positive currency translation differences,
RSHUDWLQJSUR¿WKDVLQFUHDVHGSHUFHQWRQDYHUDJH
Based on our high activity within sales, customer innovation
and new product development, on the very solid foundation
we have built, and on our strong executive and local
management, we see no reason to lower that ambition for
the coming years.
'HVSLWHFRQVLGHUDEOHJUHHQ¿HOGLQYHVWPHQWVZHKDYH
over recent years built a very strong balance sheet with
an improved equity ratio. Combined with long-term loan
agreements this has created a solid foundation for further
growth, both organically and through selective and strategic
acquisitions.
4
AAK has an important geographical footprint in regions
where both population and urbanization is increasing –
demographic changes that open up substantial market
opportunities. We are strongly supported by our customer
value propositions for health and reduced costs and our
customer product co-development and solutions approach.
Furthermore, we put a lot of focus on trends and global
key drivers that affect the behavior of end consumers –
indulgence, health, trust, personalization, and convenience.
$$.¶VRSHUDWLQJSUR¿WSHUTXDUWHU±
500
450
400
350
300
250
200
150
100
50
0
SEK million
Q1 Q2 Q3 Q4
2010 2011 2012 2013 2014 2015 2016 2017
2
31
Above the market growth Strong balance sheet supporting
further growth
Very strong underlying growth drivers
Average 10 percent year-over-year operating
SUR¿WLPSURYHPHQWIRUWKHFRPLQJ\HDUV
178
204
220
242
287
321
381
431
164
196
211
244
281
326
368
409
231
246
273
303
331
376
431
475
251
265
292
328
343
388
435
471