60
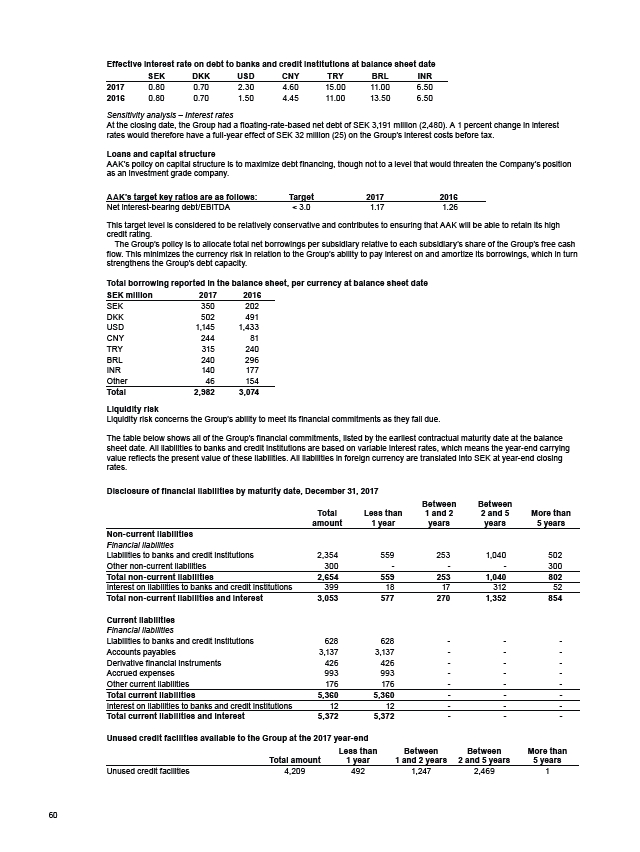
Effective interest rate on debt to banks and credit institutions at balance sheet date
SEK DKK USD CNY TRY BRL INR
2017 0.80 0.70 2.30 4.60 15.00 11.00 6.50
2016 0.80 0.70 1.50 4.45 11.00 13.50 6.50
Sensitivity analysis – Interest rates
At the closing date, the Group had a floating-rate-based net debt of SEK 3,191 million (2,480). A 1 percent change in interest
rates would therefore have a full-year effect of SEK 32 million (25) on the Group’s interest costs before tax.
Loans and capital structure
AAK’s policy on capital structure is to maximize debt financing, though not to a level that would threaten the Company’s position
as an investment grade company.
AAK’s target key ratios are as follows: Target 2017 2016
Net interest-bearing debt/EBITDA < 3.0 1.17 1.26
This target level is considered to be relatively conservative and contributes to ensuring that AAK will be able to retain its high
credit rating.
The Group’s policy is to allocate total net borrowings per subsidiary relative to each subsidiary’s share of the Group’s free cash
flow. This minimizes the currency risk in relation to the Group’s ability to pay interest on and amortize its borrowings, which in turn
strengthens the Group’s debt capacity.
Total borrowing reported in the balance sheet, per currency at balance sheet date
SEK million 2017 2016
SEK 350 202
DKK 502 491
USD 1,145 1,433
CNY 244 81
TRY 315 240
BRL 240 296
INR 140 177
Other 46 154
Total 2,982 3,074
Liquidity risk
Liquidity risk concerns the Group’s ability to meet its financial commitments as they fall due.
The table below shows all of the Group’s financial commitments, listed by the earliest contractual maturity date at the balance
sheet date. All liabilities to banks and credit institutions are based on variable interest rates, which means the year-end carrying
value reflects the present value of these liabilities. All liabilities in foreign currency are translated into SEK at year-end closing
rates.
Disclosure of financial liabilities by maturity date, December 31, 2017
Total
amount
Less than
1 year
Between
1 and 2
years
Between
2 and 5
years
More than
5 years
Non-current liabilities
Financial liabilities
Liabilities to banks and credit institutions 2,354 559 253 1,040 502
Other non-current liabilities 300 - - - 300
Total non-current liabilities 2,654 559 253 1,040 802
Interest on liabilities to banks and credit institutions 399 18 17 312 52
Total non-current liabilities and interest 3,053 577 270 1,352 854
Current liabilities
Financial liabilities
Liabilities to banks and credit institutions 628 628 - - -
Accounts payables 3,137 3,137 - - -
Derivative financial instruments 426 426 - - -
Accrued expenses 993 993 - - -
Other current liabilities 176 176 - - -
Total current liabilities 5,360 5,360 - - -
Interest on liabilities to banks and credit institutions 12 12 - - -
Total current liabilities and interest 5,372 5,372 - - -
Unused credit facilities available to the Group at the 2017 year-end
Total amount
Less than
1 year
Between
1 and 2 years
Between
2 and 5 years
More than
5 years
Unused credit facilities 4,209 492 1,247 2,469 1