65
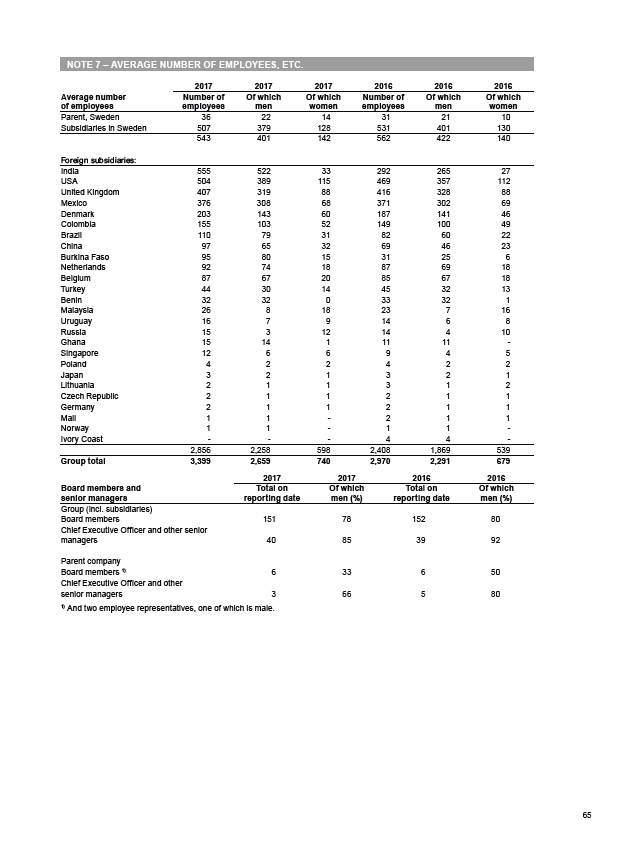
NOTE 7 – AVERAGE NUMBER OF EMPLOYEES, ETC.
Average number
of employees
2017 2017 2017 2016 2016 2016
Number of
employees
Of which
men
Of which
women
Number of
employees
Of which
men
Of which
women
Parent, Sweden 36 22 14 31 21 10
Subsidiaries in Sweden 507 379 128 531 401 130
543 401 142 562 422 140
)RUHLJQVXEVLGLDULHV
India 555 522 33 292 265 27
USA 504 389 115 469 357 112
United Kingdom 407 319 88 416 328 88
Mexico 376 308 68 371 302 69
Denmark 203 143 60 187 141 46
Colombia 155 103 52 149 100 49
Brazil 110 79 31 82 60 22
China 97 65 32 69 46 23
Burkina Faso 95 80 15 31 25 6
Netherlands 92 74 18 87 69 18
Belgium 87 67 20 85 67 18
Turkey 44 30 14 45 32 13
Benin 32 32 0 33 32 1
Malaysia 26 8 18 23 7 16
Uruguay 16 7 9 14 6 8
Russia 15 3 12 14 4 10
Ghana 15 14 1 11 11 -
Singapore 12 6 6 9 4 5
Poland 4 2 2 4 2 2
Japan 3 2 1 3 2 1
Lithuania 2 1 1 3 1 2
Czech Republic 2 1 1 2 1 1
Germany 2 1 1 2 1 1
Mali 1 1 - 2 1 1
Norway 1 1 - 1 1 -
Ivory Coast - - - 4 4 -
2,856 2,258 598 2,408 1,869 539
Group total 3,399 2,659 740 2,970 2,291 679
2017 2017 2016 2016
Board members and
senior managers
Total on
reporting date
Of which
men (%)
Total on
reporting date
Of which
men (%)
Group (incl. subsidiaries)
Board members 151 78 152 80
Chief Executive Officer and other senior
managers 40 85 39 92
Parent company
Board members 1) 6 33 6 50
Chief Executive Officer and other
senior managers 3 66 5 80
1) And two employee representatives, one of which is male.