77
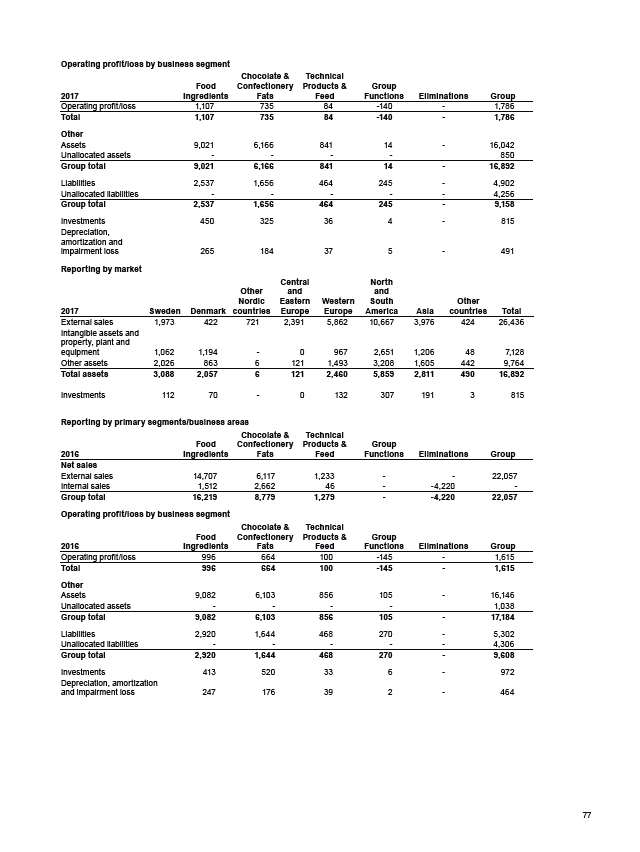
Operating profit/loss by business segment
2017
Food
Ingredients
Chocolate &
Confectionery
Fats
Technical
Products &
Feed
Group
Functions Eliminations Group
Operating profit/loss 1,107 735 84 -140 - 1,786
Total 1,107 735 84 -140 - 1,786
Other
Assets 9,021 6,166 841 14 - 16,042
Unallocated assets - - - - 850
Group total 9,021 6,166 841 14 - 16,892
Liabilities 2,537 1,656 464 245 - 4,902
Unallocated liabilities - - - - - 4,256
Group total 2,537 1,656 464 245 - 9,158
Investments 450 325 36 4 - 815
Depreciation,
amortization and
impairment loss 265 184 37 5 - 491
Reporting by market
2017 Sweden Denmark
Other
Nordic
countries
Central
and
Eastern
Europe
Western
Europe
North
and
South
America Asia
Other
countries Total
External sales 1,973 422 721 2,391 5,862 10,667 3,976 424 26,436
Intangible assets and
property, plant and
equipment 1,062 1,194 - 0 967 2,651 1,206 48 7,128
Other assets 2,026 863 6 121 1,493 3,208 1,605 442 9,764
Total assets 3,088 2,057 6 121 2,460 5,859 2,811 490 16,892
Investments 112 70 - 0 132 307 191 3 815
Reporting by primary segments/business areas
2016
Food
Ingredients
Chocolate &
Confectionery
Fats
Technical
Products &
Feed
Group
Functions Eliminations Group
Net sales
External sales 14,707 6,117 1,233 - - 22,057
Internal sales 1,512 2,662 46 - -4,220 -
Group total 16,219 8,779 1,279 - -4,220 22,057
Operating profit/loss by business segment
2016
Food
Ingredients
Chocolate &
Confectionery
Fats
Technical
Products &
Feed
Group
Functions Eliminations Group
Operating profit/loss 996 664 100 -145 - 1,615
Total 996 664 100 -145 - 1,615
Other
Assets 9,082 6,103 856 105 - 16,146
Unallocated assets - - - - 1,038
Group total 9,082 6,103 856 105 - 17,184
Liabilities 2,920 1,644 468 270 - 5,302
Unallocated liabilities - - - - - 4,306
Group total 2,920 1,644 468 270 - 9,608
Investments 413 520 33 6 - 972
Depreciation, amortization
and impairment loss 247 176 39 2 - 464