Note Segment reporting
100
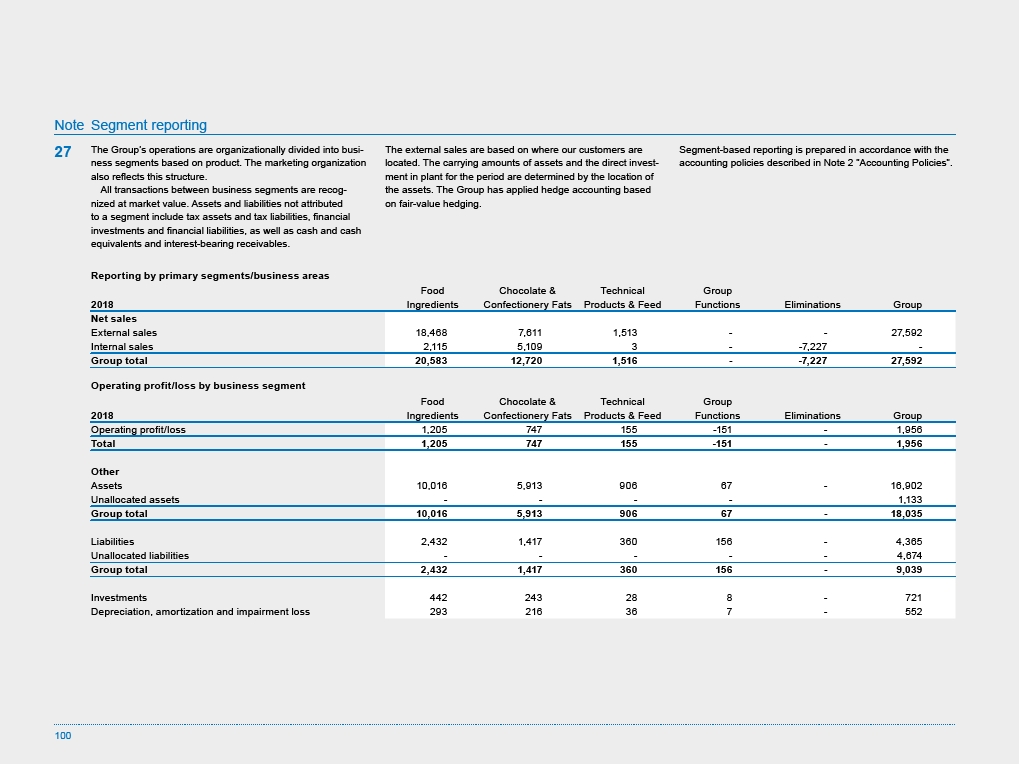
The Group’s operations are organizationally divided into business
segments based on product. The marketing organization
also reflects this structure.
All transactions between business segments are recognized
at market value. Assets and liabilities not attributed
to a segment include tax assets and tax liabilities, financial
investments and financial liabilities, as well as cash and cash
equivalents and interest-bearing receivables.
The external sales are based on where our customers are
located. The carrying amounts of assets and the direct investment
in plant for the period are determined by the location of
the assets. The Group has applied hedge accounting based
on fair-value hedging.
Segment-based reporting is prepared in accordance with the
accounting policies described in Note 2 ”Accounting Policies”.
27
Reporting by primary segments/business areas
2018
Food
Ingredients
Chocolate &
Confectionery Fats
Technical
Products & Feed
Group
Functions Eliminations Group
Net sales
External sales 18,468 7,611 1,513 - - 27,592
Internal sales 2,115 5,109 3 - -7,227 -
Group total 20,583 12,720 1,516 - -7,227 27,592
Operating profit/loss by business segment
2018
Food
Ingredients
Chocolate &
Confectionery Fats
Technical
Products & Feed
Group
Functions Eliminations Group
Operating profit/loss 1,205 747 155 -151 - 1,956
Total 1,205 747 155 -151 - 1,956
Other
Assets 10,016 5,913 906 67 - 16,902
Unallocated assets - - - - 1,133
Group total 10,016 5,913 906 67 - 18,035
Liabilities 2,432 1,417 360 156 - 4,365
Unallocated liabilities - - - - - 4,674
Group total 2,432 1,417 360 156 - 9,039
Investments 442 243 28 8 - 721
Depreciation, amortization and impairment loss 293 216 36 7 - 552