49
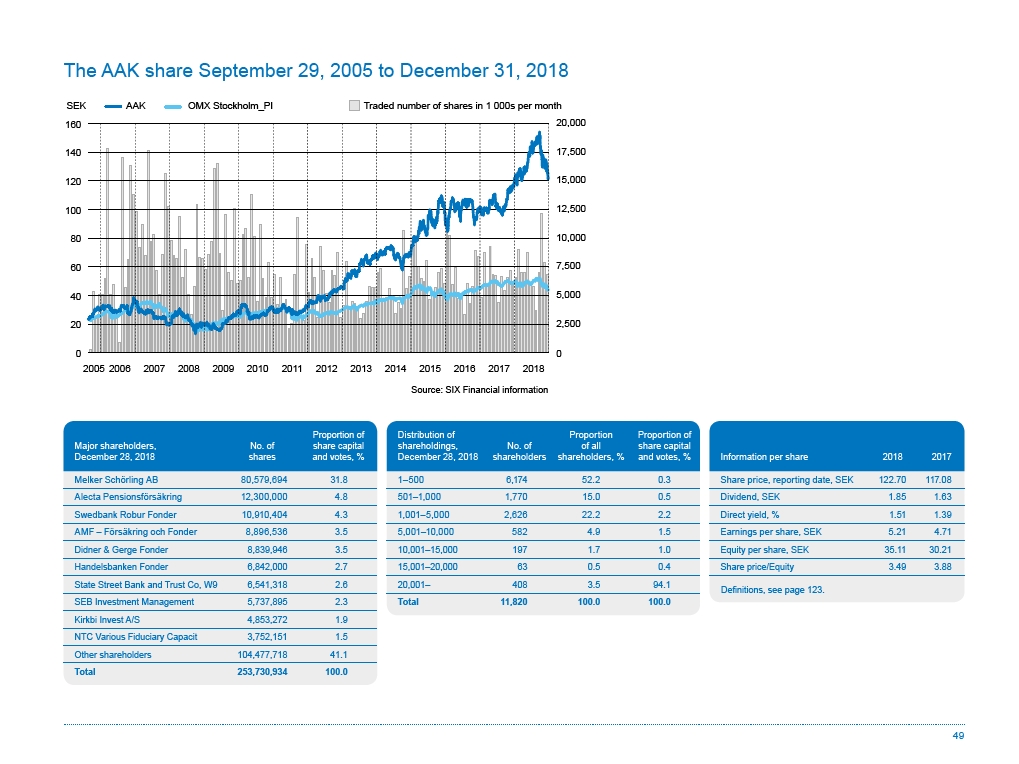
The AAK share September 29, 2005 to December 31, 2018
Traded number of shares in 1 000s per month
20,000
17,500
15,000
12,500
10,000
7,500
5,000
2,500
0
SEK AAK OMX Stockholm_PI
2005 2006 2007 2008 2009 2010 2011 2012 2013 2014 2015 2016 2017 2018
160
140
120
100
80
60
40
20
0
Source: &
Major shareholders,
December 28, 2018
No. of
shares
Proportion of
share capital
and votes, %
Melker Schörling AB 80,579,694 31.8
Alecta Pensionsförsäkring 12,300,000 4.8
Swedbank Robur Fonder 10,910,404 4.3
AMF – Försäkring och Fonder 8,896,536 3.5
Didner & Gerge Fonder 8,839,946 3.5
Handelsbanken Fonder 6,842,000 2.7
State Street Bank and Trust Co, W9 6,541,318 2.6
SEB Investment Management 5,737,895 2.3
Kirkbi Invest A/S 4,853,272 1.9
NTC Various Fiduciary Capacit 3,752,151 1.5
Other shareholders 104,477,718 41.1
Total 253,730,934 100.0
Information per share 2018 2017
Share price, reporting date, SEK 122.70 117.08
Dividend, SEK 1.85 1.63
Direct yield, % 1.51 1.39
Earnings per share, SEK 5.21 4.71
Equity per share, SEK 35.11 30.21
Share price/Equity 3.49 3.88
Distribution of
shareholdings,
December 28, 2018
No. of
shareholders
Proportion
of all
shareholders, %
Proportion of
share capital
and votes, %
1–500 6,174 52.2 0.3
501–1,000 1,770 15.0 0.5
1,001–5,000 2,626 22.2 2.2
5,001–10,000 582 4.9 1.5
10,001–15,000 197 1.7 1.0
15,001–20,000 63 0.5 0.4
20,001– 408 3.5 94.1
Total 11,820 100.0 100.0
Definitions, see page 123.
Source: SIX Financial information