109
Alternative performance measures (APM)
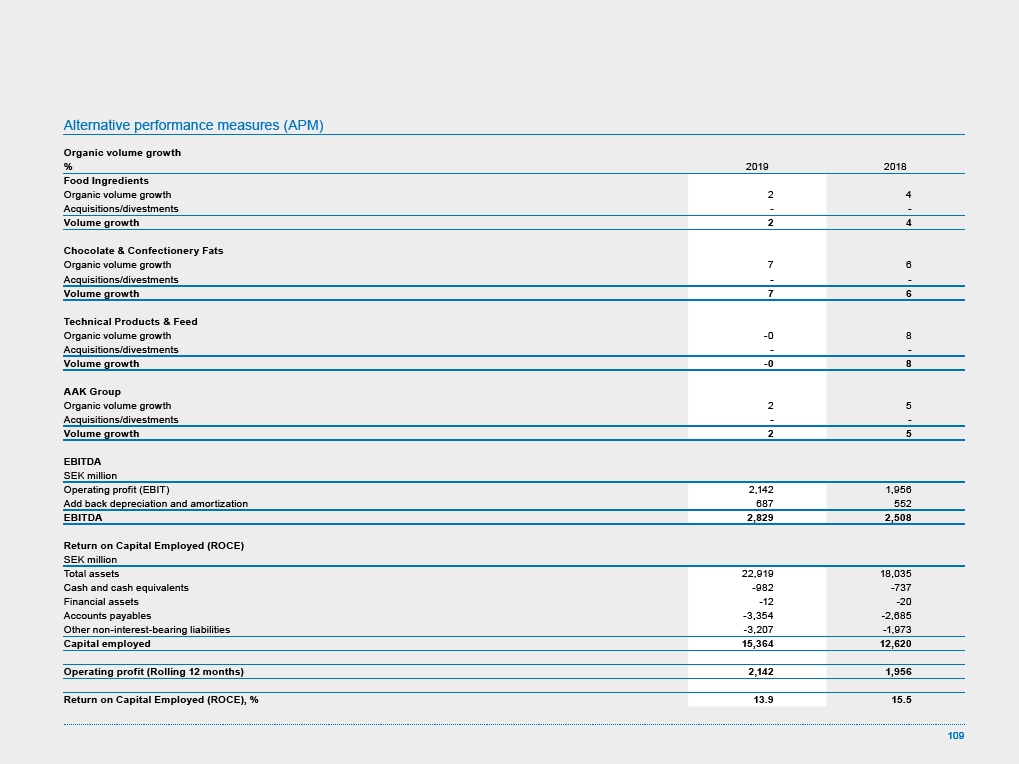
Organic volume growth
% 2019 2018
Food Ingredients
Organic volume growth 2 4
Acquisitions/divestments - -
Volume growth 2 4
Chocolate & Confectionery Fats
Organic volume growth 7 6
Acquisitions/divestments - -
Volume growth 7 6
Technical Products & Feed
Organic volume growth -0 8
Acquisitions/divestments - -
Volume growth -0 8
AAK Group
Organic volume growth 2 5
Acquisitions/divestments - -
Volume growth 2 5
EBITDA
SEK million
Operating profit (EBIT) 2,142 1,956
Add back depreciation and amortization 687 552
EBITDA 2,829 2,508
Return on Capital Employed (ROCE)
SEK million
Total assets 22,919 18,035
Cash and cash equivalents -982 -737
Financial assets -12 -20
Accounts payables -3,354 -2,685
Other non-interest-bearing liabilities -3,207 -1,973
Capital employed 15,364 12,620
Operating profit (Rolling 12 months) 2,142 1,956
Return on Capital Employed (ROCE), % 13.9 15.5