21
2015 2016 2017 2018 2019
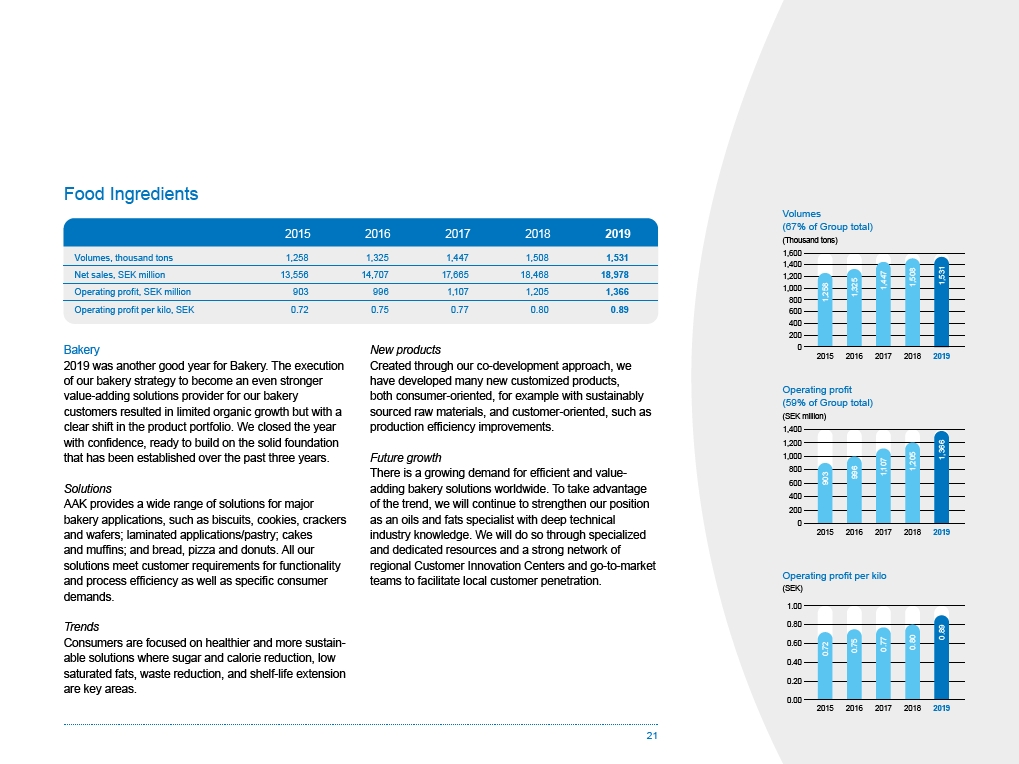
Volumes, thousand tons 1,258 1,325 1,447 1,508 1,531
Net sales, SEK million 13,556 14,707 17,665 18,468 18,978
Operating profit, SEK million 903 996 1,107 1,205 1,366
Operating profit per kilo, SEK 0.72 0.75 0.77 0.80 0.89
Bakery
2019 was another good year for Bakery. The execution
of our bakery strategy to become an even stronger
value-adding solutions provider for our bakery
customers resulted in limited organic growth but with a
clear shift in the product portfolio. We closed the year
with confidence, ready to build on the solid foundation
that has been established over the past three years.
Solutions
AAK provides a wide range of solutions for major
bakery applications, such as biscuits, cookies, crackers
and wafers; laminated applications/pastry; cakes
and muffins; and bread, pizza and donuts. All our
solutions meet customer requirements for functionality
and process efficiency as well as specific consumer
demands.
Trends
Consumers are focused on healthier and more sustainable
solutions where sugar and calorie reduction, low
saturated fats, waste reduction, and shelf-life extension
are key areas.
New products
Created through our co-development approach, we
have developed many new customized products,
both consumer-oriented, for example with sustainably
sourced raw materials, and customer-oriented, such as
production efficiency improvements.
Future growth
There is a growing demand for efficient and valueadding
bakery solutions worldwide. To take advantage
of the trend, we will continue to strengthen our position
as an oils and fats specialist with deep technical
industry knowledge. We will do so through specialized
and dedicated resources and a strong network of
regional Customer Innovation Centers and go-to-market
teams to facilitate local customer penetration.
Volumes
(67% of Group total)
(Thousand tons)
2015 2016 2017 2018 2019
1,600
1,400
1,200
1,000
800
600
400
200
0
1,508
1,531
1,447
1,325
1,258
Operating profit
(59% of Group total)
(SEK million)
2015 2016 2017 2018 2019
1,400
1,200
1,000
800
600
400
200
0
Operating profit per kilo
(SEK)
2015 2016 2017 2018 2019
1.00
0.80
0.60
0.40
0.20
0.00
1,366
0.89
1,205
0.80
1,107
0.77
996
0.75
0.72 903
Food Ingredients