2018 in brief
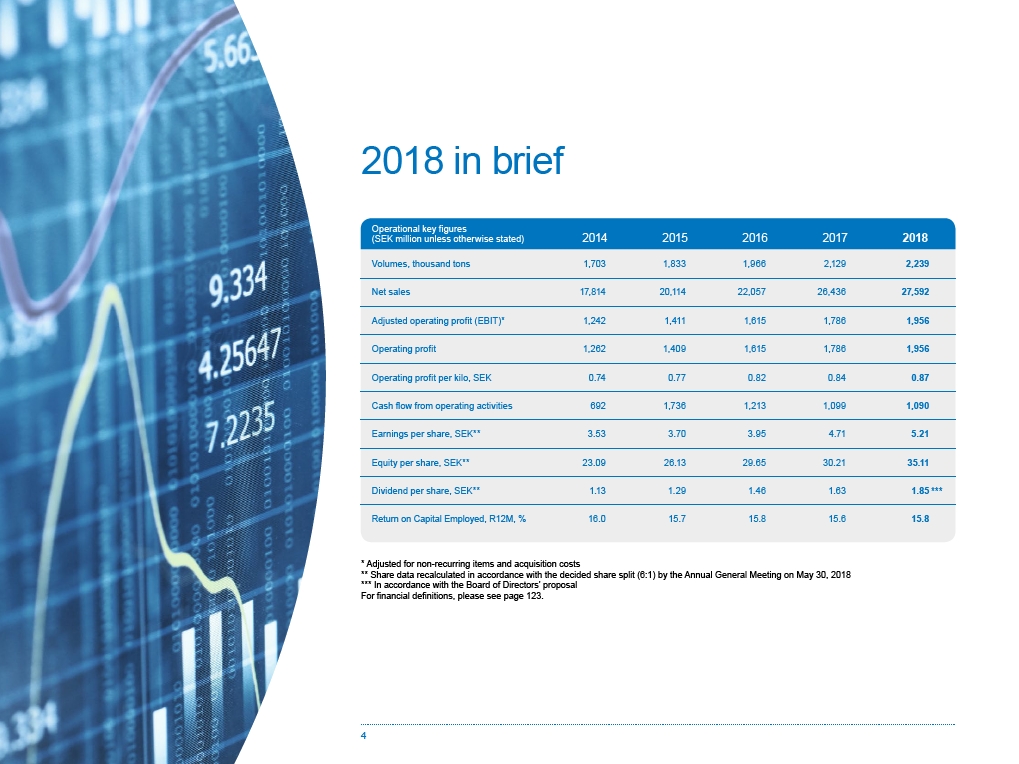
Operational key figures
(SEK million unless otherwise stated) 2014 2015 2016 2017 2018
Volumes, thousand tons 1,703 1,833 1,966 2,129 2,239
Net sales 17,814 20,114 22,057 26,436 27,592
Adjusted operating profit (EBIT)* 1,242 1,411 1,615 1,786 1,956
Operating profit 1,262 1,409 1,615 1,786 1,956
Operating profit per kilo, SEK 0.74 0.77 0.82 0.84 0.87
Cash flow from operating activities 692 1,736 1,213 1,099 1,090
Earnings per share, SEK** 3.53 3.70 3.95 4.71 5.21
Equity per share, SEK** 23.09 26.13 29.65 30.21 35.11
Dividend per share, SEK** 1.13 1.29 1.46 1.63 1.85 ***
Return on Capital Employed, R12M, % 16.0 15.7 15.8 15.6 15.8
* Adjusted for non-recurring items and acquisition costs
** Share data recalculated in accordance with the decided share split (6:1) by the Annual General Meeting on May 30, 2018
*** In accordance with the Board of Directors’ proposal
For financial definitions, please see page 123.
4