Air
AAK has aligned data collection and disclosure with
the Greenhouse Gas Protocol during 2019 and initiated
Scope 1 and 2 reporting*. In total, AAK generated
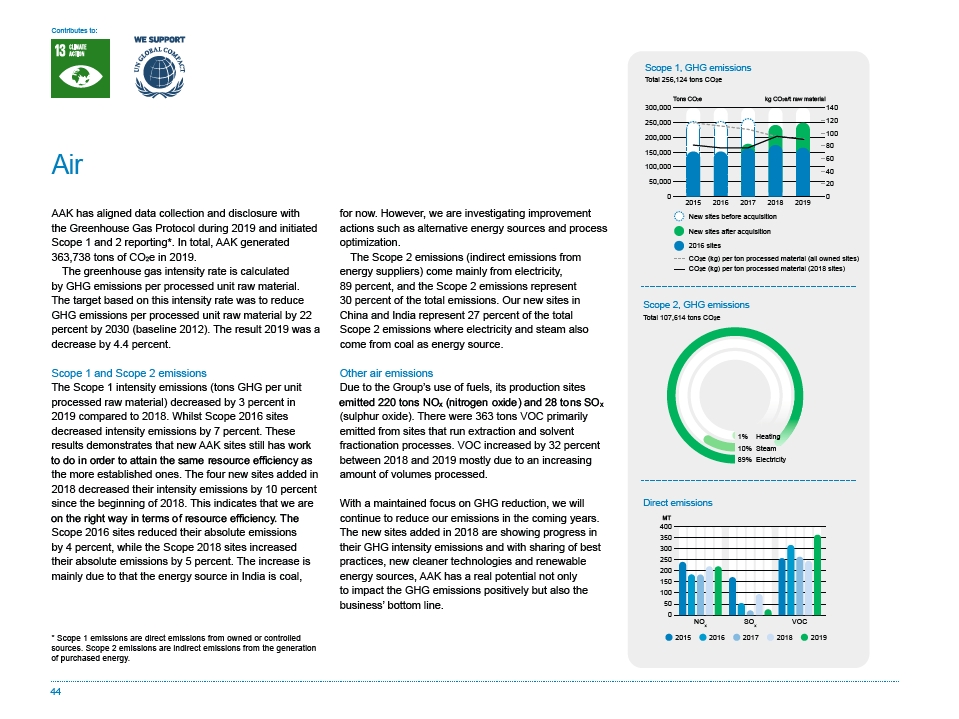
363,738 tons of CO2e in 2019.
The greenhouse gas intensity rate is calculated
by GHG emissions per processed unit raw material.
The target based on this intensity rate was to reduce
GHG emissions per processed unit raw material by 22
percent by 2030 (baseline 2012). The result 2019 was a
decrease by 4.4 percent.
Scope 1 and Scope 2 emissions
The Scope 1 intensity emissions (tons GHG per unit
processed raw material) decreased by 3 percent in
2019 compared to 2018. Whilst Scope 2016 sites
decreased intensity emissions by 7 percent. These
results demonstrates that new AAK sites still has work
WRGRLQRUGHUWRDWWDLQWKHVDPHUHVRXUFHHI¿FLHQF\DV
the more established ones. The four new sites added in
2018 decreased their intensity emissions by 10 percent
since the beginning of 2018. This indicates that we are
RQWKHULJKWZD\LQWHUPVRIUHVRXUFHHI¿FLHQF\7KH
Scope 2016 sites reduced their absolute emissions
by 4 percent, while the Scope 2018 sites increased
their absolute emissions by 5 percent. The increase is
mainly due to that the energy source in India is coal,
44
Direct emissions
MT
400
350
300
250
200
150
100
50
0
NOx SOx VOC
2015 2016 2017 2018 2019
Contributes to:
for now. However, we are investigating improvement
actions such as alternative energy sources and process
optimization.
The Scope 2 emissions (indirect emissions from
energy suppliers) come mainly from electricity,
89 percent, and the Scope 2 emissions represent
30 percent of the total emissions. Our new sites in
China and India represent 27 percent of the total
Scope 2 emissions where electricity and steam also
come from coal as energy source.
Other air emissions
Due to the Group’s use of fuels, its production sites
HPLWWHGWRQV12ೌQLWURJHQRLGHDQGWRQV62ೌ
(sulphur oxide). There were 363 tons VOC primarily
emitted from sites that run extraction and solvent
fractionation processes. VOC increased by 32 percent
between 2018 and 2019 mostly due to an increasing
amount of volumes processed.
With a maintained focus on GHG reduction, we will
continue to reduce our emissions in the coming years.
The new sites added in 2018 are showing progress in
their GHG intensity emissions and with sharing of best
practices, new cleaner technologies and renewable
energy sources, AAK has a real potential not only
to impact the GHG emissions positively but also the
business’ bottom line.
Scope 1, GHG emissions
Total 256,124 tons CO2e
2015 2016 2017 2018 2019
300,000
250,000
200,000
150,000
100,000
50,000
0
140
120
100
80
60
40
20
0
Tons CO2e kg CO2e/t raw material
New sites before acquisition
New sites after acquisition
2016 sites
CO2e (kg) per ton processed material (all owned sites)
CO2e (kg) per ton processed material (2018 sites)
Scope 2, GHG emissions
Total 107,614 tons CO2e
1% Heating
10% Steam
89% Electricity
* Scope 1 emissions are direct emissions from owned or controlled
sources. Scope 2 emissions are indirect emissions from the generation
of purchased energy.