made in last year’s data in order to adjust the heating
value and CO2e emission values in line with a centrally
calculated framework. Combustion from own vehicles
and smaller working machines and fugitive emissions
are not included in the calculations due to limited data
quality. However, those emissions are considered to be
very small in relation to the total Scope 1 emissions and
work is ongoing to cover this gap during 2020.
Scope 2
(Indirect GHG emissions from energy purchase)
7KLVLVWKH¿UVW\HDUWKDW$$.GLVFORVHVFRSHLQGLUHFW
HPLVVLRQV)RUHOHFWULFLW\WKHHPLVVLRQVDUHFDOFXODWHG
according to market-based method (GHG protocol)
which is used to support the development of renew-
DEOHHQHUJ\E\SXUFKDVLQJ*XDUDQWHHVRIRULJLQV)RU
markets without a system of Guarantees of origins
for electricity, AAK has used the average electricity
HPLVVLRQIDFWRUIRUWKHVSHFL¿FPDUNHWWRFDOFXODWHWKH
emissions from the electricity use.
Scope 3
(GHG emissions beyond scope 1 and 2)
During 2019 AAK has, with support from a third party,
conducted a scope 3 screening, i.e. a rough assessment
of AAK’s emission in the whole supply chain. The
scope 3 screening shows that about 90 percent of the
emissions in the supply chain are category 1: purchased
goods and services. When inbound and outbound transport
and upstream emissions for consumed energy and
fuels are added more than 99 percent of the emissions
are covered. It will therefore be prioritized to get more
VSHFL¿FGDWDIRUHPLVVLRQVIURPSXUFKDVHGJRRGVDQG
services going forward as well as data for emissions
from inbound and outbound transport. All in order to
work with mitigation and reduction of our climate impact
in a structured manner, including the supply chain.
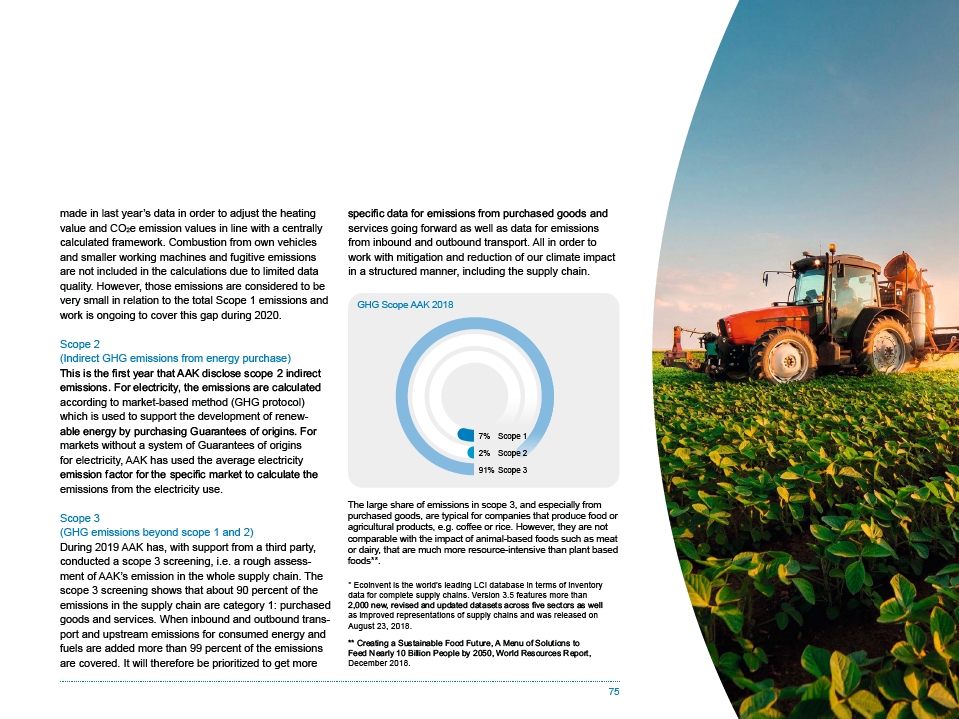
The large share of emissions in scope 3, and especially from
purchased goods, are typical for companies that produce food or
agricultural products, e.g. coffee or rice. However, they are not
comparable with the impact of animal-based foods such as meat
or dairy, that are much more resource-intensive than plant based
foods**.
75
GHG Scope AAK 2018
7% Scope 1
2% Scope 2
91% Scope 3
* Ecoinvent is the world’s leading LCI database in terms of inventory
data for complete supply chains. Version 3.5 features more than
QHZUHYLVHGDQGXSGDWHGGDWDVHWVDFURVV¿YHVHFWRUVDVZHOO
as improved representations of supply chains and was released on
August 23, 2018.
&UHDWLQJD6XVWDLQDEOH)RRG)XWXUH$0HQXRI6ROXWLRQVWR
)HHG1HDUO\%LOOLRQ3HRSOHE\:RUOG5HVRXUFHV5HSRUW
December 2018.